6.2 TURBOPUMP SYSTEM PERFORMANCE AND DESIGN PARAMETERS
Turbopump performance and design parameters are closely related. Variation of the turbopump design and operating parameters will contribute to the optimization of both turbopump and engine system performance. The turbopump system design procedure includes the evaluation of all possible design approaches and mechanical configurations which can satisfy engine system specifications. From this, the selection of the best design with respect to overall systems reliability and performance is made.
Turbopump System Performance
The "best performing" turbopump system is simply defined as that which affords the heaviest payload for a vehicle with a given thrust level, range or velocity increment; gross stage takeoff weight; and thrust chamber specific impulse (based on propellant combination, mixture ratio, and chamber operating efficiency). Turbopump performance affects the vehicle payload in three ways:
- Turbopump component weight.-Since the weight of the turbopump components is part of stage burnout weight, it directly affects stage payload.
- Required pump-inlet suction pressure head.-Required suction pressure directly translates into required main propellant tank pressure level. If it is raised, tank and pressurization system weights increase and thus reduce the stage payload for a given burnout weight.
- Turbine gas flow rate.-Since the turbine drive gases, the flow rate of which is a function of propellant types and flow rates, pump discharge pressures, and of pump and turbine efficiencies, are usually ejected at a lower specific impulse than the thrust chamber gases (except in the case of the topping cycle), their flow rate decreases the overall engine system specific impulse and thus decreases the allowable vehicle stage burnout weight. For a fixed weight of engines, tanks, guidance, and other equipment, a decrease in allowable stage burnout weight results in decrease of payload weight.
The relation between turbine gas flow rate and stage payload weight can be expressed by an equivalent-weight factor, EWF, which is defined as the decrease of payload weight ( lb ) as a function of turbine flow rate ( ). EWF is proportional to the ratio between turbine exhaust specific impulse and thrust chamber specific impulse .
The total effect of the turbopumo on allowable vehicle stage payload, i.e., the equivalent weight of the turbopump, EW , is the sum of turbopump component weight, , and the product of EWF and the turbine weight flow rate, :
Equation (6-2) permits a quantitative definition of the "best performing" turbopump system possessing the lowest equivalent weight. Values for the turbopump equivalent-weight factor EWF range from for booster stage engines to for upper stage engines. The equivalent-weight EW helps to establish the optimized point between turbine and pump efficiencies, and corresponding turbopump component weights. It is not practical to include the effects of pump inlet pressure on vehicle tank weights, since the required information is usually unavailable to the turbopump designer. It is advisable however, that the pumps should be designed for the lowest possible inlet pressure.
Sample Calculation (6-1)
The following design data are set forth for the hypothetical A-1 stage engine:
Turbopump weight, Turbine gas flowrate, Turbopump equivalent-weight factor EWF, Determine the turbopump equivalent weight (EW) per engine.
Solution
From equation (6-2): Turbopump equivalent weight per engine
Turbopump System Design Parameters
In the design of turbopump systems the following parameters, which are often interdependent, are considered paramount and will be discussed: (1) Propellant properties (2) Pump developed heads and flow rates (3) Pump specific speeds (4) Pump net positive suction head (NPSH) (5) Pump efficiencies (6) Turbine overall performance and operating efficiency (7) Turbopump system cycle efficiency (8) Turbopump system calibration and offdesign characteristics No simple rules are available for optimizing the correlations of these parameters when designing a specific type of turbopump for a given engine systems application. Generally speaking, however, available pump suction pressure together with the basic pump flow characteristics will determine the maximum shaft speed at which the unit can operate. The higher this shaft speed, the lower the turbopump weight is likely to be. Once the pump speed is determined, turbine type, turbine driving arrangement, and turbine power source are selected on the basis of efficiency, weight, simplicity, and other factors.
Propellant Properties
General data for some propellants used in liquid rocket engines are given in tables to 1-5. Table 6-3 lists those properties of commonly used liquid propellants which have specific significance in the design of pumps. These propellants include Earth-storable liquids such as RP-1 and , cryogenics such as and , and liquids having a wide range of physical and chemical properties.
The low temperature of cryogenic liquids creates problems with turbopump construction materials, seals, bearings, lubricants, and through the danger of ice formation. The total temperature range to which the structural elements of a cryogenic turbopump may be exposed varies from
Table 6-3.-Fluid Properties of Commonly Used Liquid Propellants
| Liquid | Data at normal conditions | |||||
|---|---|---|---|---|---|---|
| Temperature, | Vapor pressure, psia | Density. | Conversion factors | Viscosity. lb-sec/sq in | ||
| Head, ft Pressure, psi | ||||||
| 60 | 11.1 | 90.7 | 1.59 | 4.96 | ||
| (90 percent) | 60 | . 026 | 87.8 | 1.64 | 5.12 | |
| 60 | 158 | 63.3 | 2.28 | 7.12 | ||
| RP-1 | 60 | 031 | 50.8 (max) | 2.83 (min) | ||
| 49.8 (min) | 2.89(max) | 9.00(max) | ||||
| Ethyl-alcohol (95 percent) | 60 | 62 | 50.4 | 2.85 | 8.91 | |
| UDMH | 60 | 1.83 | 49.66 | 2.90 | 9.06 | |
| 50 percent UDMH | 60 | 1.77 | 56.66 | 2.54 | 7.94 | |
| -297.6 | 14.7 | 71.17 | 2.02 | 6.32 | ||
| -307 | 14.7 | 94.21 | 1.54 | 4.79 | ||
| -422.9 | 14.7 | 4.43 | 32.5 | 101.5 | ||
| -320.4 | 14.7 | 50.44 | 2.86 | 8.92 | ||
| Water | 60 | . 256 | 62.37 | 2.31 | 7.2 |
Normal conditions do not necessarily mply standard conditions, if tank pressures have been applied. Included here because these fluids are frequently used as pump calibration media. -300 to at the pumps to at the turbine. This induces temperature gradients between the various turbopump components which must be accommodated and requires structural flexibility or suitable devices to permit the required thermal expansion and contraction. Radial connecting pins are often employed to permit a cryogenic pump to contract independently of a turbine and/or of a normal-temperature pump.
The vapor pressure of the propellants under normal engine operation conditions directly influences total suction pressure requirements at the pump inlet. This will be further discussed in conjunction with the pump inlet net positive suction head (NPSH).
The density variations of different propellants produce substantially different pump headrise requirements, as well as large differences in volume flow. The power required per unit weight flow and pressure rise of a pump is inversely proportional to the density of the fluid. This is shown dramatically in the case of liquid hydrogen which has a density of less than 10 percent of that of other propellants. For the same weight flow and pressure rise, a liquid hydrogen pump requires more than 10 times the volume flow and driving power as compared to other propellant pumps. Thus the design of liquid hydrogen pumps requires specific considerations.
The viscosity of the pumped fluids effects a boundary layer along the surface of the flow passages within the pump. There is a minimum size of the impeller cross-section below which pump performance will fall off rapidly. As the passage clearances in the impeller are decreased, a point will be reached where the flow is predominantly boundary layer, and viscous rather than turbulent forces become predominant. This completely changes the performance of a pump. The drag effect of the boundary layers, together with the rotation of the fluid in certain pump passages from an axial to a radial direction, such as in the impeller of a centrifugal pump, results in secondary flows being set up. This, together with friction losses which also are in direct proportion to the viscosity of the fluid, and with leakage losses, constitutes a major portion of the energy losses in a pump. It is seen that a high propellant viscosity tends to lower pump efficiency.
Some liquid propellants, such as and , are highly reactive chemically, and thermally unstable, beyond certain temperature limits. In the design of turbopumps for these propellants, special consideration must be given to the selection of compatible materials as well as to the construction of mechanical parts. Seals, bearings, and the protection (insulation) of the pump section against heat influx from the turbine section following engine shutdown, are typical problem areas.
Pump Developed Heads and Flow Rates
The term "pump developed head," , is defined as the difference between pump discharge head and pump suction head. The relationship between developed fluid pressure and fluid head is given by
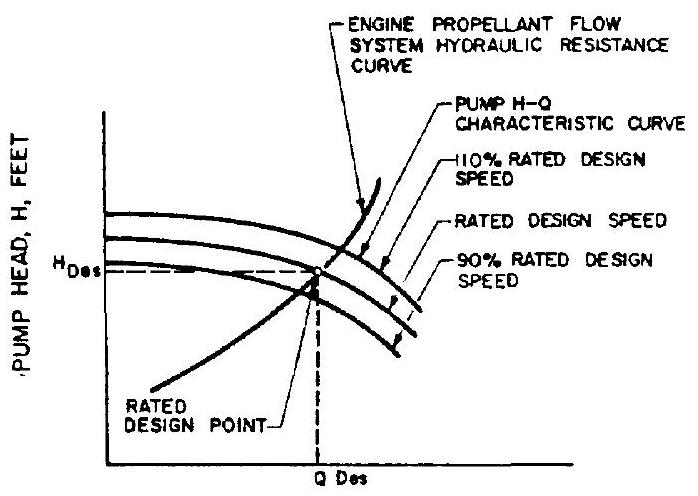
The required pump developed head at the design propellant flow rate (i.e., engine thrust level) is dictated by the sum of the hydraulic resistances within the engine propellant flow system. These resistances include the pressure drops across injector, thrust chamber manifold, cooling jacket, propellant valves and ducts, as well as the injector end thrust chamber pressure. An additional pressure margin is usually allowed for systems calibration. An engine propellant flow system hydraulic resistance curve representing the resistance head to flow-rate relationship at various pump operating levels is shown in figure 6-19.
Any value for developed fluid head of a given pump is tied to a corresponding level of fluid flow at any impeller rotating speed. At the maximum flow rates, the entire pump drive energy is consumed by internal flow losses and kinetic energy imparted to the fluid. Thus the measured head rise at the pump outlet is zero. At the other extreme, where fluid flow is zero (except for secondary flows), head rise is a maximum. A pump developed head versus flow capacity curve, commonly called curve, is derived by connecting the pump operating points between the two extremes for constant speeds. A family of curves is thus obtained experimentally for the range of speeds through which the pump may operate, all of them having similar parabolic shape. Typical H-Q curves of a pump at various speeds are shown in figure 6-19, along with the system flow resistance curve. Together they form the design operating range of a system.
Two dimensionless coefficients are frequently used to indicate the head and flow characteristics of a given pump. They are the pump head coefficient and the pump flow coefficient . The pump head coefficient is the ratio of rated pump head (ft) to the maximum theoretical head at zero flow for meridional (axial) inlet (no prerotation) expressed as
where overall pump head coefficient at rated design point (range is 0.2 to 0.7 for single stage centrifugal pumps and up to 1.5 to 2.0 for multistage axial pumps, depending on number of stages) pump rated developed head, ft mean tip velocity of pump impeller at rated design rotating speed, ft/sec =gravitational constant, The pump flow coefficient can be expressed as
 PUMP FLOW RATE, Q, opm
Figure 6-19.-Engine system resistance and pump characteristic curves. where o = overall pump flow coefficient at rated design point (range 0.01 to 0.15 in rocket engine application) velocity of pump flow in meridional direction at rated design point,
Pump Specific Speeds
For any given pump design, the relation between fluid flow rate , developed fluid head , required driving power , and rotating speed can be defined by three expressions called the affinity laws of a pump. These laws state: (1) Pump volume flow rate varies directly with speed:
(2) Pump developed head varies directly as the square of the speed:
(3) Pump driving power varies directly as a cube of the speed:
The affinity laws are based on the assumption that the pump efficiency is independent of the rotating speed. Actual pump operation has shown, however, that pump efficiency does change with speed. The degree depends on the individual pump design, but is usually not more than 2 or 3 percent within a reasonable range from the rated design point. Furthermore, it affects only the power requirements rather than the relationship between developed head and flow rate. Thus the pump affinity laws hold quite well in most cases.
The relationships established in equations (6-6a), (6-6b), and (6-6c) permit us to derive a useful pump design parameter, the pump specific speed, :
where pump specific speed (dimensionless) pump rotating speed, rpm pump flow rate, gpm pump developed head, feet Pump specific speed is a characteristic value defined as the rpm required to produce flow at 1 -foot head rise across the pump impeller (or across the combination of inducer and impeller). In pump design, this term is very useful to classify inducers or impellers on the basis of their performance and geometric proportions regardless of the actual size or speed at which they operate. is a function of design configuration; it does not vary significantly for a series of geometrically similar impellers (having the same angles and proportions), or for one particular impeller operating at any speed.
Since the characteristic curve of a pump ranges from zero flow at shutoff to zero head at maximum flow, the specific speed for one curve varies from zero to infinity. To make the term definite, it is necessary to relate it to a defined condition. The logical point is that of maximum efficiency, usually the rated design point. It is generally understood that this point is meant when specific speed is stated.
Figure 6-20 indicates typical pump specific speeds for various impeller geometries. For a given speed, a low value of specific speed is characteristic for low-volume flow, high-headrise pumps. Higher specific speed indicates a higher volume flow, low-head-rise pump.
- Radial-type impeller.-The head is largely developed by the action of centrifugal force. This type is used for heads above 200 feet. Specific speed ranges from 500 to 1200 . Geometric proportion, , varies from 2 to 3 .
- Francis-type impeller.-This type has an axial inlet, a radial discharge, and is used for lower heads. Specific speed ranges from 1200 to 2400. Geometric proportion, , varies from 1.3 to 1.8 .
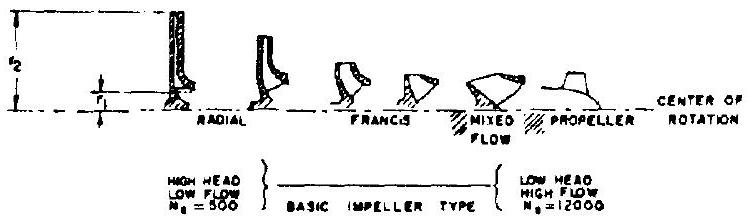 Figure 6-20.-Relationship between the pump specific speeds and pump impeller geometries.
- Mixed-flow type impeller.-The head developed in this impeller is due partly to change in tangential velocity and partly to change in fluid velocity relative to the rotor. The discharge is partly radial and partly axial. The impeller vanes are doubly curved. Specific speed varies from 2200 to 3500.
- Propeller-type impeller.-The head developed by this type is through push of the vanes only. Flow direction is axial. Specific speeds range from 3000 to 6000 for multistage impellers, and from 6000 to 12000 for inducers.
Sample Calculation (6-2)
The following data are given for the propellant pumps of the hypothetical A-1 stage engine at the rated design point:
| Pump | Fluid density, | Pump inlet suction pressures. psia (total) | Pump discharge pressure, psia | Pump weight now rate, lb/sec | Pump speed, rpm |
|---|---|---|---|---|---|
| Oxidizer. | 71.38 | 55 | 1505 | 1971 | 7000 |
| Fuel.... | 50.45 | 45 | 1720 | 892 | 7000 |
Determine the pump specific speeds.
Solution
Oxidizer pump developed pressure,
From equation (6-3): Oxidizer pump developed head,
Since Oxidizer pump volume flow rate,
From equation (6-7): Oxidizer pump specific speed,
Fuel pump developed pressure,
From equation (6-3): Fuel pump developed head,
Fuel pump volume flow rate,
From equation (6-7): Fuel pump specific speed,
Pump Net Positive Suction Head; Cavitation
Steady flow operation of a pump creates a low-pressure area at the pump inlet, thus allowing the static head upstream of the pump to push fluid into the inlet at a continuous rate. There are local regions within the pump which are at static pressures even lower than the inlet static pressure. If the static pressure of the fluid at the pump inlet or any regions within the pump is allowed to drop below the local fluid vapor pressure level, these regions will cavitate; i.e., the fluid will pass from liquid to vapor and form bubbles. The formation of vapor alters the effective flow passages of the fluid and hence seriously affects normal pump performance. The subsequent collapse of these vapor regions creates local pressure forces which can result in flow instabilities and/or substantial damage.
To avoid cavitation during operation of a propellant pump, the pump-inlet available net positive suction head, (NPSH) , furnished by the propellant feed system upstream of the pump, must be higher than the suction head above the propellant vapor pressure at which cavitation would set in. (NPSH) is the difference between the propellant inlet total pressure head and the propellant vapor pressure. This can be expressed as:
where
In design practice the term "critical net positive suction head," or , is used to indicate the minimum suction head required above the propellant vapor pressure to assure suppression of cavitation. This critical net positive suction head is defined by convention, as that value which will result in a 2 -percent headgeneration loss at the rated design speed and flow rate of a given pump. Usually further reduction in inlet NPSH below the (NPSH) point results in rapidly increasing cavitation. In turn, the developed head is further reduced, and nonsteady flow can result. This fluctuation of propellant flow can cause erratic combustion in the thrust chamber. Figure 6-21 represents the cavitation characteristics of a typical pump operated at rated design speed. To insure a margin of safety for pump operation, the (NPSH)
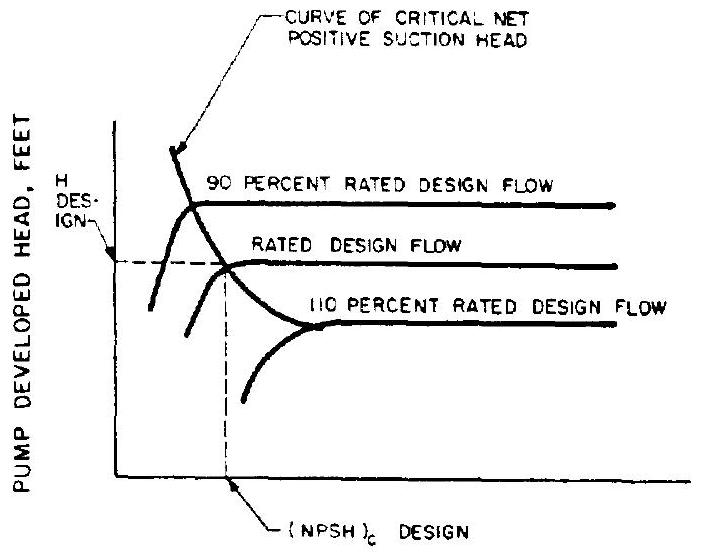 net positive suction head at the pump inlet, feet Figure 6-21.-Typical cavitation characteristics of a pump operated at rated design speed.
supplied by the vehicle must be larger than the (NPSH) of the propellant pumps, or
net positive suction head at the pump inlet, feet Figure 6-21.-Typical cavitation characteristics of a pump operated at rated design speed.
supplied by the vehicle must be larger than the (NPSH) of the propellant pumps, or
It is useful to compare the suction characteristics of various pump designs on the basis of a design parameter called suction specific speed, , which is defined as follows:
where
Suction specific speed is related to the critical net positive suction head in the same manner the specific speed is related to overall pump developed head. Design values of suction specific speeds for rocket propellant pumps range from 10000 without inducers approximately to 55000 with inducers.
Another coefficient describing pump suction characteristics is the Thoma parameter 7 . It is the ratio of critical net positive suction head and rated pump developed head , or
The Thoma parameter is a function of pump design quality and specific speed.
For a given vehicle (NPSH) , the pump suction characteristics ( ) determine the maximum permissible rpm at the design flow rate. A high pump or vehicle permits a higher pump rpm, lower turbopump weight, and possibly higher turbine performance. It is desirable to operate a pump at the highest practicable speed. Figure 6-22 represents the results of a parametric turbopump system design study for a typical booster stage rocket engine system, such as the A-1 stage engine. The study reflects the effects of , and on the selection of turbopump configuration.
In addition to the pump values during steady-state operation, the engine starting transient pump (NPSH) must be determined and specified to permit satisfactory engine acceleration from zero to nominal design speed and flow rate in the desired time and manner. The starting (NPSH) depends on the rate of acceleration and on the control system of the engine, as well as on vehicle acceleration, gravity effects, and propellant suction duct geometry. Therefore, sufficient tank pressure must be provided to accelerate the propellant and to overcome the hydraulic resistance in the suction duct, as well as to supply the necessary pump (NPSH) during all phases of system operation.
Sample Calculation (6-3)
(a) The following test data are given for the propellant pumps of the A-1 stage:
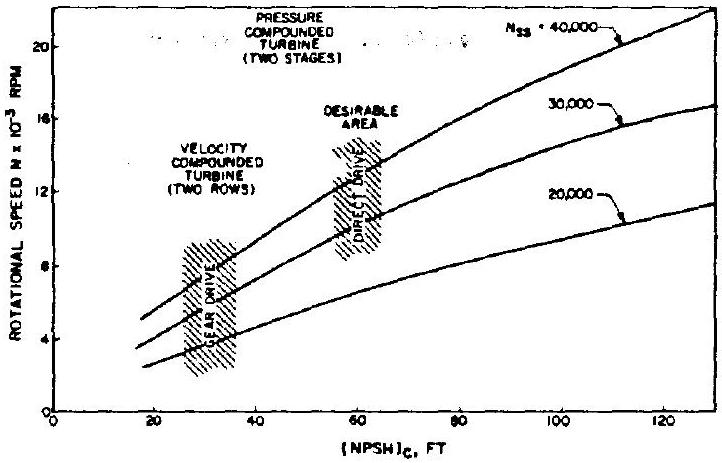 Figure 6-22.-Effects of , and on turbopump configuration selection for a typical booster stage rocket engine system.
| Pump | Pump speed. rpm | Fluid pumped | Pump volume flow rate. gpm | Pump developed head, ft | Pump (NPSH) ft |
|---|---|---|---|---|---|
| Oxidizer ... | 7000 | 12420 | 2930 | 58 | |
| Fuel ..... | 7000 | 7960 | 4790 | 70 |
Determine pump suction specific speeds and Thoma parameters. (b) The following system design data are given for the A-1 stage vehicle:
| Pump | Fluid density, | Tank pressure, psia | Longitudinal distance between tank and pump inlet, ft | Permanent static pressure loss in suction duct, including valves, psi | Propellant temperature at pump inlet, |
|---|---|---|---|---|---|
| Oxidizer | 71.38 | 60 | 3.5 | 5 | -297.6 |
| Fuel ... | 50.45 | 50 | 25 | 8 | 60 |
The dynamic head at the pump inlet is considered a part of the available NPSH and thus is not subtracted from the tank pressure.
Determine the available NPSH at the pumpinlets.
Solution
(a) Substitute given data into equation (6-10):
Oxidizer pump suction specific speed,
Fuel pump suction specific speed,
Substitute given data into equation (6-11): Thoma parameter of the oxidizer pump,
Thoma parameter of the fuel pump,
(b) From table 6-3:
Vapor pressure of liquid oxygen
Vapor pressure of RP-1 psia at Assume the vehicle is at sea-level holddown condition and substitute given data into equation (6-8):
Available NPSH at oxidizer pump inlet
Available NPSH at fuel pump inlet
Pump Operational Efficiency; Losses
Several types of energy losses occur during pump operation which affect efficiency.
- Hydraulic losses.-These include friction losses in the passages and flow turbulence losses. The friction losses are a function of the "wetted areas" in the passages and of the roughness of their surfaces. The turbulence losses are caused by disturbances in certain regions of the pump, such as at the inlet and outlet edge of the vanes of both impeller and diffuser and in the return guide vanes.
- Disk friction losses.-The energy required to rotate a disk, such as an impeller or inducer, in a fluid is known as disk friction loss. The disk friction losses are due to two actions: namely, (a) the actual friction of the fluid on the disk, which is relatively minor, and (b) a pumping action on the fluid in contact with the disk, whereby the fluid is circulated locally by centrifugal action. The energy loss due to disk friction is transformed into heat and can appreciably increase the temperature of the fluid.
- Mechanical losses.-These are losses in bearings and seals caused by mechanical friction.
- Leakage losses.-To prevent the pumped fluid from leaking back to the suction side after it has passed the impeller and is at outlet pressure levels, close-clearance labyrinth-type seals or wearing rings are provided. Leakback lowers the now capacity of a pump and thus increases required pumping power.
For a new design, losses are difficult to predict and are usually estimated from data derived during actual testing and other past experience with similar designs.
The overall efficiency of a pump, , can be expressed by the ratio of pump fluid horsepower output, fhp. to brake horsepower input by the pump drive, bhp:
The pump fluid horsepower fhp is the actual usable output delivered by the pump. It is the product of delivered propellant weight flow, (lb/sec), times the actual head developed by the pump, divided by a conversion factor:
The brake horsepower bhp represents the mechanical horsepower delivered to the pump by the drive. This delivered brake horsepower is consumed in the pump as fluid horsepower and as the various losses.
where bhp = brake horsepower fhp = fluid horsepower horsepower required to overcome hydraulic losses horsepower required to overcome disk friction losses horsepower required to overcome mechanical losses horsepower required to overcome leakage loss The efficiency of a pump is related to the volume flow rate , the developed head , and the rotating speed , all of which are included in the pump specific speed . Of these, the most important one is the design volume flow rate or capacity of the pump. There is a definite trend toward increased efficiency with higher pump capacities, because hydraulic, disk friction, and mechanical losses represent a smaller percentage of the total brake horsepower when large capacities are being handled. On the other hand, increased pump-developed head and rotating speed for a pump of given capacity results in lower efficiency because of increased disk fricticn and mechanical losses. The overall efficiency of rocket engine propellant pumps of high developed head and rotating speed ranges from 60 to 85 percent. This is about 10 percent lower than that of industrial pumps. The variation of pump efficiency with specific speed, at various pump capacities, is shown in figure 6-23. Figure 6-24 shows the correlation between pump flow rate and the following three parameters: developed head, efficiency, and required brake horsepower, for a typical centrifugal pump.
Sample Calculation (6-4)
The following test data are given for the propellant pumps of the A-1 stage engine:
| Pump | Fluid pumped | Pump volume flow rate, gpm | Pump developed head, ft | Drive shaft power, hp |
|---|---|---|---|---|
| Oxidizer . | 12420 | 2930 | 14850 | |
| Fuel . | 7960 | 4790 | 11790 |
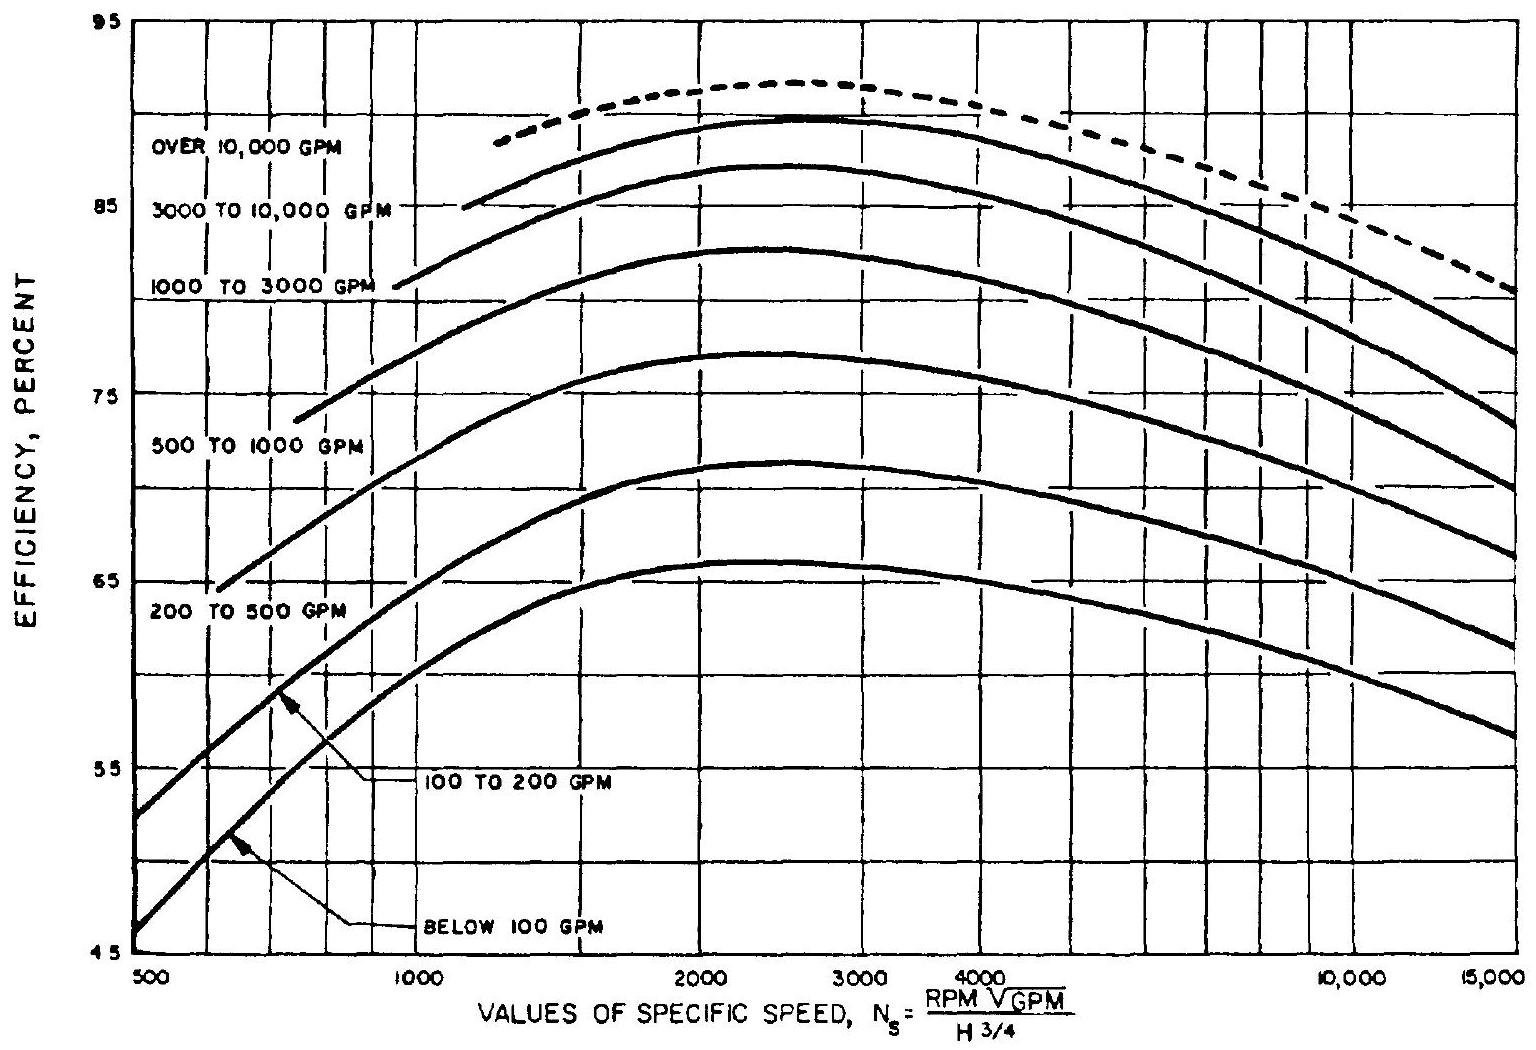 Figure 6-23.-Variation of pump efficiency with specific speed. .
Determine the overall efficiencies of both pumps.
Solution
Substitute given data and flow rates from sample calculation (6-2) into equation (6-13):
Oxidizer pump fluid horsepower
Fuel pump fluid horsepower
Substitute into equation (6-12):
Oxidizer pump overall efficiency
Fuel pump overall efficiency
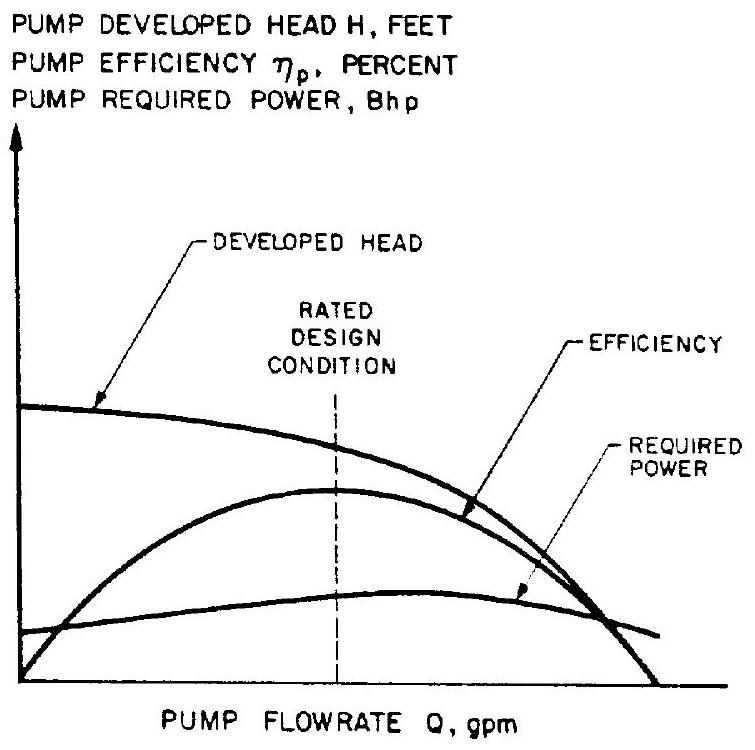 Figure 6-24.-H-Q, efficiency, and required power characteristic curves of a typical centrifugal pump.
Turbine Overall Performance and Operating Efficiency
The overall performance of a turbine is defined as the ratio of turbine shaft horsepower output, thp, and required turbine working-fluid flow rate, , in pounds per second or
Overall turbine performance
In general, turbine overall performance depends upon two variables: the available energy content per pound of turbine working-fluid, , and the overall turbine operating efficiency, .
The available energy content of the turbine working fluid is defined as the enthalpy drop per pound of working fluid in the turbine
where available energy content of the working fluid, Btu/lb enthalpy per unit weight of the working fluid at turbine-inlet, enthalpy per unit weight of the working fluid at exhaust pressure, Btu/lb, assuming isentropic expansion Using equations (1-10) and (1-13), equation (6-16) can be rewritten as
where working fluid specific heat at constant pressure, Btu/lb-F working fluid total temperature at turbine inlet, working fluid static temperature at turbine exhaust, working fluid total pressure at turbine inlet, psia working fluid static pressure at turbine exhaust, psia working fluid specific heat ratio The ratio of turbine inlet and exhaust pressures, , can be expressed as the turbine pressure ratio , which is a frequently used parameter in turbine design.
It is seen that the available energy in the turbine working fluid is a function of gas properties and inlet temperature, and of the turbine pressure ratio. Most of the turbine working fluids for rocket engine application are fuel-rich product gases generated by bipropellant combustion. Typical working fluid properties are listed in table 6-4.
Figure 6-25 shows the relationship between turbine-inlet temperature and available working fluid energy for a turbine pressure ratio of 20 for the two propellant combinations and . Turbine inlet temperatures are limited by the high-temperature properties of the turbine construction materials. A practical design limit is around . Above certain levels the gain from a higher turbine-inlet tem-
Table 6-4.-Properties of Typical Fuel-Rich Combustion Product Gases
| Fluid | Inlet temperature | , Btu/ | , | Mixture ratio, O/F | |
|---|---|---|---|---|---|
| LOX/RP-1........ | 1100 | 0.635 | 1.097 | 43.3 | 0.303 |
| 1150 | . 639 | 1.100 | 45.1 | 320 | |
| 1200 | 643 | 1.106 | 47.1 | 337 | |
| 1250 | . 646 | 1.111 | 58.6 | 354 | |
| 1300 | . 648 | 1.115 | 50.4 | . 372 | |
| 1350 | . 651 | 1.119 | 51.8 | . 390 | |
| 1400 | . 653 | 1.124 | 53.6 | . 408 | |
| 1450 | 655 | 1.128 | 55.4 | . 425 | |
| 1500 | . 657 | 1.132 | 58.0 | 443 | |
| 1550 | 659 | 1.137 | 59.0 | . 460 | |
| 1600 | 660 | 1.140 | 60.7 | 478 | |
| 1650 | . 661 | 1.144 | 62.4 | . 497 | |
| 1700 | . 662 | 1.148 | 64.0 | 516 | |
| (UDMH) | 1400 | . 380 | 1.420 | 87.5 | 110 |
| 1500 | . 398 | 1.420 | 91.6 | . 165 | |
| 1600 | . 416 | 1.420 | 95.7 | . 220 | |
| 1700 | . 434 | 1.420 | 99.9 | . 274 | |
| 1800 | . 452 | 1.420 | 104.0 | . 328 | |
| 1900 | . 470 | 1.420 | 108.2 | 382 | |
| 1000 | 2.05 | 1.374 | 434 | . 785 | |
| 1200 | 1.94 | 1.364 | 403 | 903 | |
| 1400 | 1.86 | 1.354 | 378 | 1.025 | |
| 1600 | 1.80 | 1.343 | 358 | 1.143 | |
| 1800 | 1.73 | 1.333 | 336 | 1.273 | |
| 2000 | 1.69 | 1.322 | 320 | 1.410 |
perature is offset by the turbine efficiency losses (blade losses; see below) resulting from higher gas jet speed (spouting velocity ) which is proportional to the turbine-inlet temperature.
Figure 6-26 shows the relationship between turbine pressure ratio and available energy of the working fluid for a turbine-inlet temperature of , again for the propellant combinations and . Although a large amount of energy may be available in a working fluid, it may be difficult to convert it efficiently into turbine shaft horsepower because of the severe weight limitations on rocket engine turbopumps. Thus the available pressure ratio of a turbine often cannot be fully used.
The overall efficiency of a turbine, , is defined as the ratio of turbine shaft horsepower,
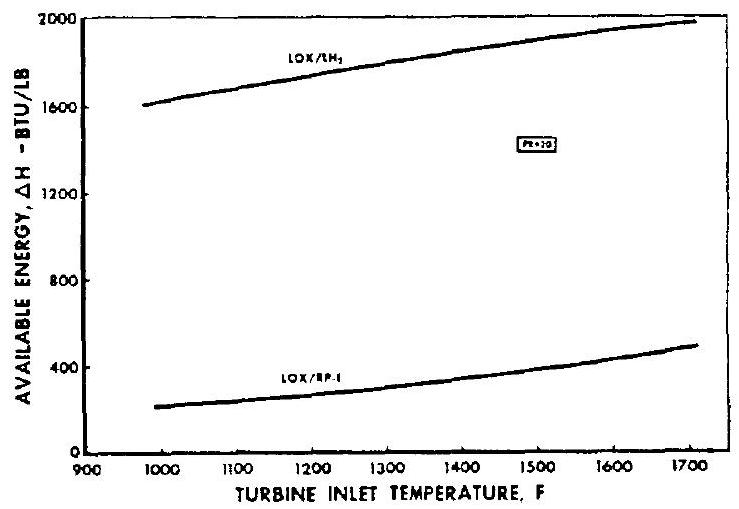 Figure 6-25.-Effect of turbine-inlet temperature on working fluid available energy.
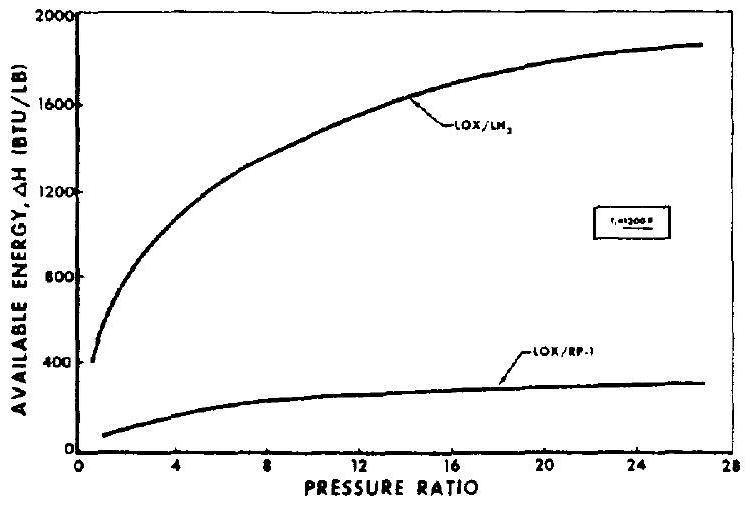 Figure 6-26.-Effect of turbine pressure ratio on working fluid available energy.
thp, to enthalpy drop rate or the available energy delivered rate of the working fluid.
Combining equations (6-15) and (6-19): Turbine overall performance
In turbine operation efficiency can be affected by-
- Nozzle losses.-Similar to those in thrust chamber nozzles, these losses are due to the gas leaving the nozzle at a lower velocity as compared to that of an ideal nozzle. The losses are due to flow turbulence, fluid friction, and loss of heat to and through the turbine nozzle blocks.
- Blade losses.-These are caused by residual velocity of the gas as it leaves the rotor blades, the obliquity of the nozzle (i.e., the nozzle angle in fig. 6-8 cannot be made zero), flow turbulence, and fluid friction. Losses due to residual gas velocity can be reduced by optimizing the turbine blade-to-gas velocity ratio , where is the pitch speed of the rotor blades, and is the ideal spouting velocity of the gas based on available energy and isentropic expansion. These conditions can be analyzed quantitatively by means of turbine gas flow velocity diagrams which will be discussed in section 6.5. Flow turbulence can be reduced through improved blade shape and through full turbine nozzle admission.
- Leakage or clearance losses.-The clearance required between rotor blade tips and casing permits some gas to leak past the blades without doing work, thus causing energy losses. The gas leakage from stage to stage in a multistage pressure-compounded turbine due to required clearance between shaft and sealing diaphragm results in similar losses.
- Disk friction losses.-Fluid friction occurs at the interface of gas and rotor disk surface.
Also, centrifugal action of the rotor disk causes some of the gas to flow radially to the casing and to be dragged along the face of the casing by the rotor blades. 5. Mechanical losses.-These result from the mechanical friction in bearings and rotating seals.
The design of turbines for rocket turbopumps tends toward the simpler and lighter impulse types, with most of the expansion occurring in the stationary elements. Figure 6-27 shows the typical efficiency curves of various impulse-type turbines. The design problem becomes one of balancing efficiency (optimum velocity ratio , weight (number of stages or rows), and structural considerations. A higher performance can be achieved by employing a working fluid with high available energy, and by matching its high gas spouting velocity with a high rotor blade pitch speed . However, the blade speed is often limited by the required pump rpm, by the practical size of the rotor wheel, and by the strength of materials. The optimum velocity ratio (or optimum value of blade speed for a given gas spouting velocity) is reduced by the use of velocity or pressure-compounded arrangements (shown schematically in fig. 6-9 and 6-10). However, these designs increase weight and complexity.
In general, for a direct-drive configuration (fig. 6-13) with an rpm lower than ideal, a low value of results, and a velocity compounded turbine will be used because of its low overall weight and simplicity. Where a reduction gear is
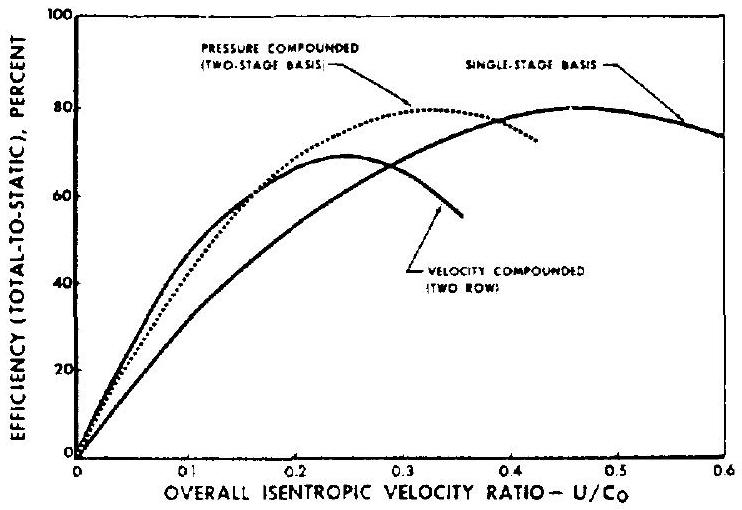 Figure 6-27.-Typical efficiency curves of impulse-type turbines.
provided between pumps and turbine, a higher value of is possible and a more efficient pressure-compounded turbine can be used.
Since the turbine pressure ratio has only a small effect upon available energy content of the working fluid (fig. 6-26), the power level of a turbine is usually regulated by controlling the inlet pressure and in turn the flow rate of the turbine.
Sample Calculation (6-5)
The following test data are given for the turbine of the A-1 stage engine turbopump:
Turbine gas mixture ratio, Gas total temperature at turbine-inlet, Gas total pressure at turbine-inlet, psia Gas static pressure at turbine exhaust, psia Turbine gas flow rate, Turbine shaft speed, 7000 rpm Turbine shaft torque, Determine the overall turbine efficiency in percent and the performance in horsepower per of turbine flow .
Solution
From table 6-4, for a mixture ratio of 0.408 , we derive a specific heat and a specific heat ratio .
Substitute the above and other given data into equation (6-17) to obtain the available energy content of the turbine gas:
Turbine shaft horsepower
Total shaft horsepower required by the pumps (sample calculation (6-4)):
Thus a margin of 510 hp is available for auxiliary drives and contingencies.
Substitute the values for thp, , and into equation (6-19):
Overall turbine efficiency
From equation (6-15): Overall turbine performance
Turbopump System Cycle Efficiency
Turbopump system cycle efficiency is an indicator of the energy losses and their effect on overall engine systems performance because of turbopump operation. It can be defined as the ratio of the specific impulse of the complete turbopump-fed engine system, , to the thrust chamber specific impulse, .
Turbopump cycle efficiency
Generally, two types of energy cycles are employed in rocket turbopump applications: the separate-flow cycle and the topping-flow cycle. Because of certain systems-design limitations the second type is used less frequently than the former.
In the separate-flow cycle the turbine exhaust gas flow is discharged separately or is ducted into the low-pressure region of the main thrust chamber exit nozzle. This is shown schematically for cases (A), (B), and (C) in figure 6-12, and for the A-1 and A-2 stage engines in figures 2-10 and 3-3. The separate-flow cycle system design affords a lower discharge pressure by the propellant pumps and yields a higher pressure ratio for the turbine. Generally, this results in a simpler and lighter system. However, the turbine exhaust gas of a separate-flow cycle is usually not utilized efficiently to generate thrust.
Thus, it has a relatively low cycle efficiency. The separate-flow cycle efficiency can be expressed as
where
The efficiency of the separate-flow cycle can be increased somewhat by better utilization of the turbine exhaust gases to generate thrust. A higher expansion area nozzle may be attached to the turbine exhaust duct for upper stage engine applications, for a higher , or the turbine exhaust gases may be burned with additional propellant in an afterburner similar to that in a jet engine. Separate-flow-cycle efficiencies range from 0.96 to 0.99 .
In the topping flow cycle the turbine exhaust gases, before being expanded and ejected through the thrust chamber nozzle, are ducted into the thrust chamber combustion zone for further reaction with one of the main propellants. This is illustrated schematically in cases (D) and (E) of figure 6-12. Because this system requires a turbine exhaust pressure higher than the thrust chamber pressure, it results in higher propellant pump discharge pressures and a much lower turbine pressure ratio. Also, for bipropellant combinations, two-stage combustion is required. Usually combustion products of 100 percent of one propellant and a portion of the other are used as the turbine drive fluid. This method results in higher cycle efficiency, but tends to be heavier and less flexible.
Since the residual kinetic and chemical energies of the turbine exhaust gas are generating thrust as efficiently as the main propellants, the topping flow cycle is sometimes considered a "no loss" cycle. However, that net energy which is required to lift the propellants from their respective pump inlet pressures to the thrust chamber nozzle stagnation pressure must be considered. The topping flow cycle efficiency may be approximated as
where topping flow cycle efficiency ideal energy required to pump 1 pound total propellant flow of an engine system from pump inlet to main cham- ber nozzle stagnation pressures specific heat of the thrust chamber gases, Btu/lb-F thrust chamber nozzle stagnation tem- perature, = propellant mixture ratio of the engine system, O/F pressure head, based on the difference between thrust chamber nozzle stag- nation and oxidizer pump inlet pres- sures, ft =pressure head, based on the difference between thrust chamber nozzle stag- nation and fuel pump inlet pressures, ft Topping flow cycle efficiencies may range from 0.996 to 0.9996 . Typical cycle efficiency versus chamber pressure curves of various propellants are illustrated in figure 6-28.
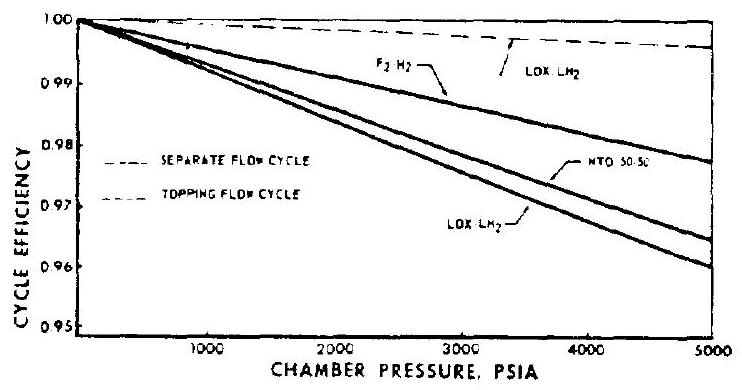 Figure 6-28.-Typical cycle efficiency versus chamber pressure curves of various propellants.
Sample Calculation (6-6)
(a) The following component test results are given for the A-1 stage engine, as schematically shown in figure 2-10, for sea level and rated design conditions:
Thrust chamber oxidizer flow rate, 1941 lb/sec Thrust chamber fuel flow rate, Thrust chamber nozzle stagnation pressure, 1000 psia Thrust chamber thrust, 747300 lb Gas generator oxidizer flow rate, Gas generator fuel flow rate, Thrust generated by turbine exhaust, 2700 lb Determine the cycle efficiency of the turbopump system, engine system sea-level specific impulse and thrust, and overall engine system propellant mixture ratio at rated conditions. (b) Assume that, as an alternate, a topping flow cycle is used for the turbopump of the A-1 stage engine and that this engine system is to be operated at the same engine system thrust and mixture ratio as in case (a). Estimate the ideal turbopump cycle efficiency and engine system sea-level specific impulse with the following assumptions: (1) no change in , combustionproduced gas properties, and performance of the thrust chamber due to the minor changes in mixture ratio and two-stage combustion; (2) oxidizer pump inlet pressure ; and (3) fuel pump inlet pressure .
Solution
(a) Thrust chamber mixture ratio
Thrust chamber propellant flow rate
Sea-level thrust chamber specific impulse
Turbine gas flow rate
Sea-level turbine exhaust specific impulse
Total engine system propellant flow rate
Substitute the above data into equation (6-22) to obtain the flow cycle efficiency of the turbopump
From equation (6-21), the engine system specific impulse at sea level
Total engine system thrust
Engine system mixture ratio
The calculations can also be made by first combining and to derive . Then and are used to calculate can be calculated by forming the ratio to . (b) Use the combustion product gas properties from sample calculation (4-1) (a):
Pressure head difference between chamber pressure and oxidizer pump inlet:
Pressure head difference between chamber pressure and fuel pump inlet:
Substitute these data into equation (6-23) for the topping flow cycle efficiency of the turbopump
Since , substitute and into equation (6-21); the ideal engine system specific impulse
Turbopump System Calibration and Off-Design Characteristics
Ideally, an engine system is designed to operate at a single set of conditions, specifically at rated thrust and mixture ratio. Each of its components in turn is designed for optimum function at that rated thrust level. In addition, however, most of these engine components, notably pumps and turbines, are also required to operate satisfactorily within a certain range away from the design point. This may be caused by- (1) System and component calibration characteristics (2) System operational deviations (3) System start and shutdown transients (4) Special system requirements, such as throttling Figure 6-29 illustrates typical operating ranges for the turbopump of a rocket engine system. The elliptically shaped areas represent ranges of operational probability. For instance, the 95 -percent ellipse envelopes those values at which the pumps or turbine will operate with a 95 -percent probability.
Because of engine and component performance tolerance requirements and to correct for hydrodynamic variations within the components, it is
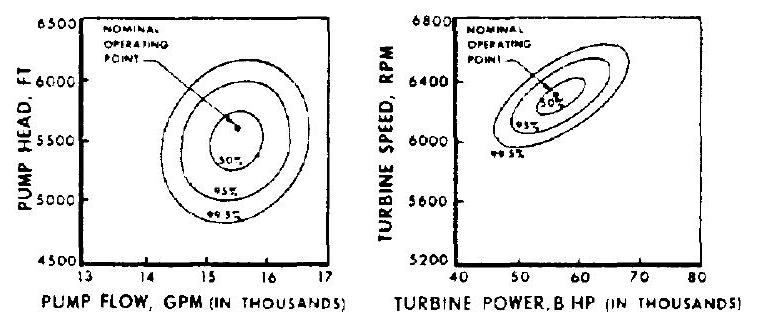 Figure 6-29.-Typical pump and turbine operating ranges of a rocket engine system.
necessary to calibrate a turbopump prior to its integration into an engine system. Here, the performance of each pump is determined experimentally. By modifying the pump geometry (impeller trimming) and varying the discharge hydraulic resistances, the desired operating characteristics required by the engine system are achieved. For turbopumps with a single direct or geared turbine drive (as shown in fig. 6-13), the calibration procedure begins with the experimental determination of that shaft speed at which one of the pumps (usually the oxidizer pump) develops the required head and flow. Simultaneously, the suction characteristics of this pump are determined at this speed. The other pump is then operated at the same speed and the discharge adjusted for the required flow. Based on the pressure readings, the diameter of the pump impeller is trimmed on a lathe until the desired head is produced at rated speed and flow. The pump suction characteristics at these conditions are also determined. Figure 6-30 shows the trimming effects of a typical pump. The trimming procedure requires that the pump impellers be made sufficiently large initially, since addition of material is not feasible. The calibrated pumps are then combined with a turbine. The amount of turbine working fluid which must be bled from the pump discharges to operate
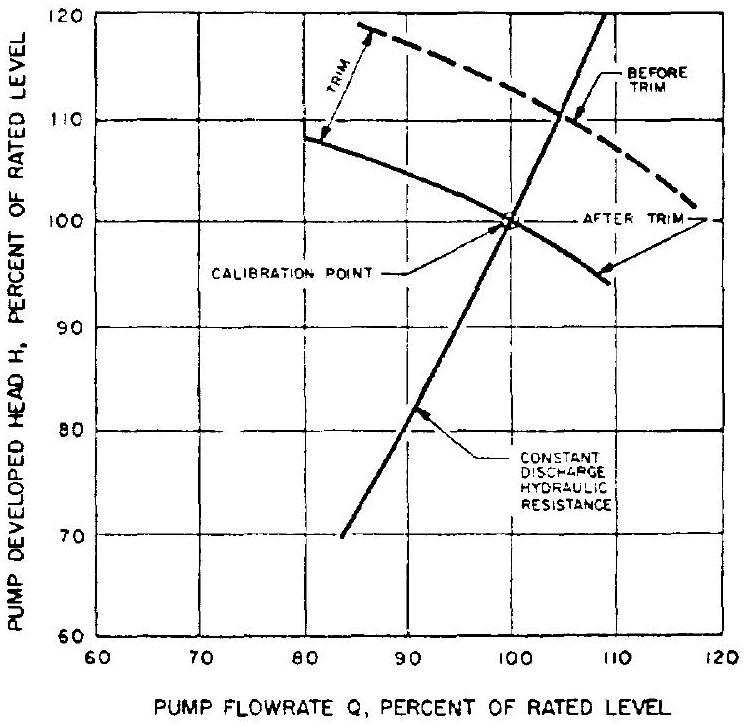 Figure 6-30.-Trimming effects of a typical pump.
the gas generator is now established experimentally at the required operating point. This procedure considers the influence of turbine variations. The turbopump is then matched with the remaining engine system in complete engine systems calibrations. Adjustments in engine mixture ratio can be made by orificing the discharge of one of the pumps. Orifice installation considerations and type of propellant often make it desirable to assure that orificing is always done for the same propellant; in LOX/RP systems, usually the fuel. For this reason, the pump for that system is trimmed for a slight excess head. Adjustments in engine thrust level are made by varying the turbopump speed.
An engine system is frequently required to operate at certain off-design levels. For instance, upper stage vehicles often require an effective propellant utilization system based on variation of the engine mixture ratio. (See ch. II.) This involves control of the discharge of one pump and possibly the control of turbine supply gas if correction of thrust due to the shifting of mixture ratio is desired. Design and development of the turbopump must consider these operational requirements.
During the start and shutdown transients of an engine system, propellant flow and pressure characteristics are determined by engine system design characteristics. Figure 6-31 shows the propellant flows and chamber pressure buildup history for a typical engine start transient. Note temporary oxidizer flow drop as a result of LOX
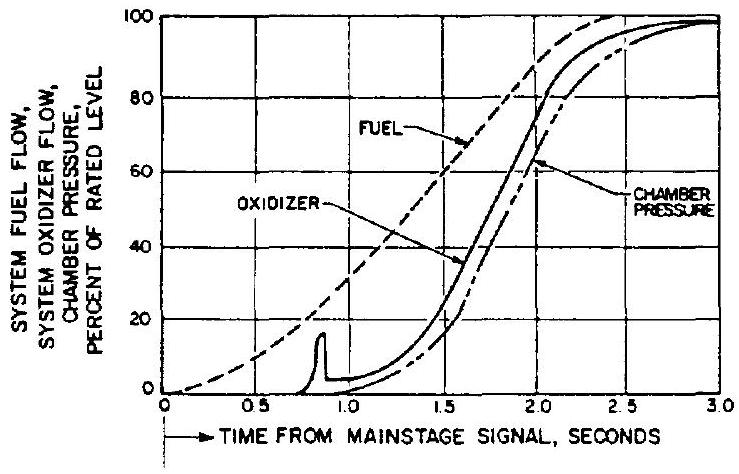 Figure 6-31.-Propellant flow and chamber pressure transient characteristics during engine system start.
dome priming. The time in which a rocket turbopump must attain full-power level is substantially shorter than that of conventional turbomachinery. Frequently, full-power operation must be achieved in less than 1 second. This is dictated by the need for propellant consumption economy in flight and for avoiding the possibility of flow instability in thrust chamber and other components. This, together with other transient requirements such as throttling, must be satisfied by the off-design characteristics of a turbopump. The latter substantially influence selection of type. Basically, the problem is that of coupling the pump characteristics with those of the rest of the engine system under off-design operating conditions. Figure 6-32 shows typical off-design characteristics of various types of pumps.
One of the most significant pump off-design characteristics is the pump stalling point which usually occurs in the low-flow region. The pump operation tends to be erratic at this point, resulting in the abrupt loss of developed head and the danger of overspeeding.
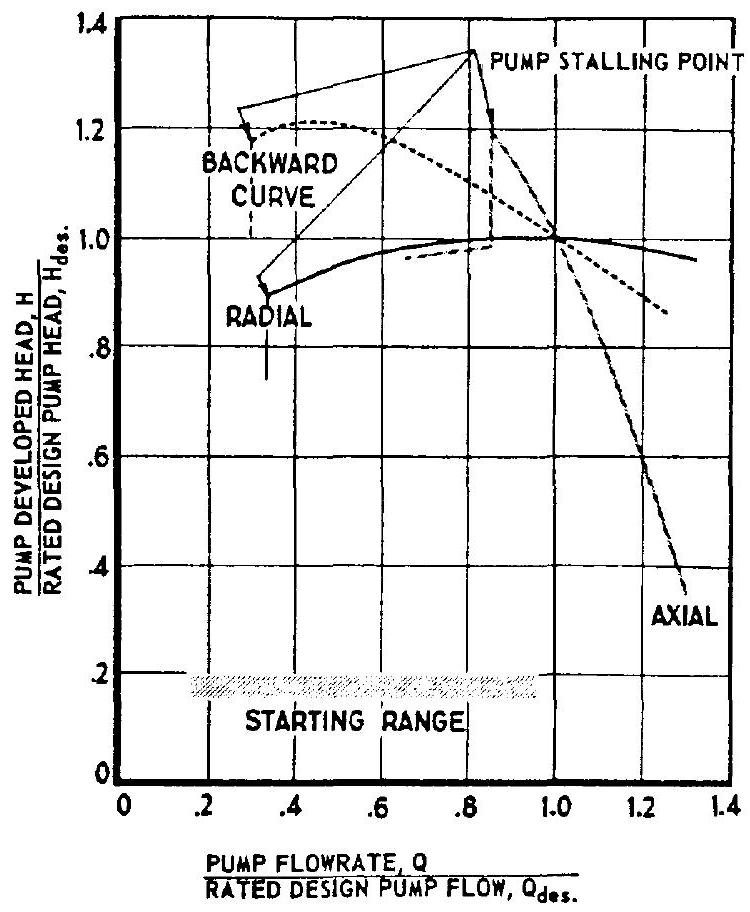 Figure 6-32.-Typical off-design characteristics of various types of pumps.